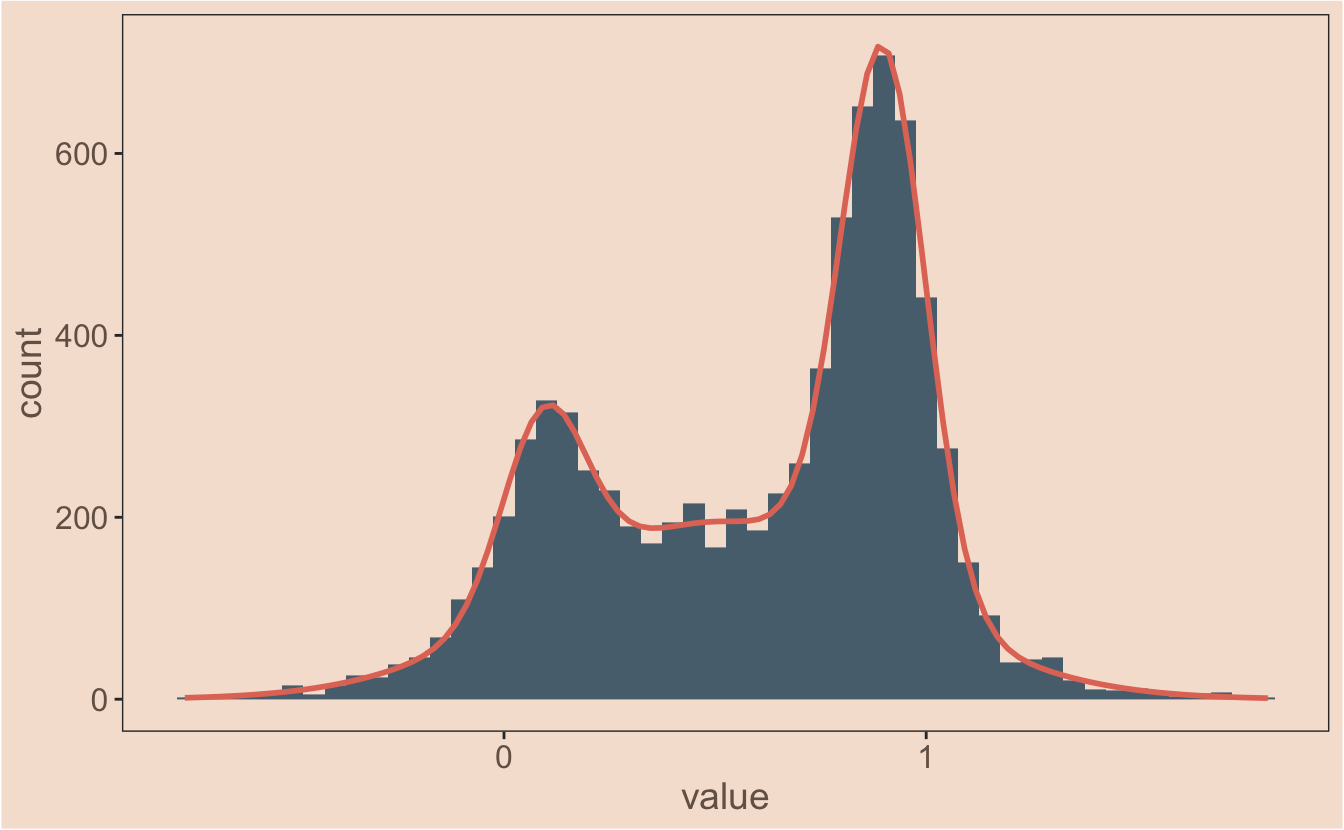
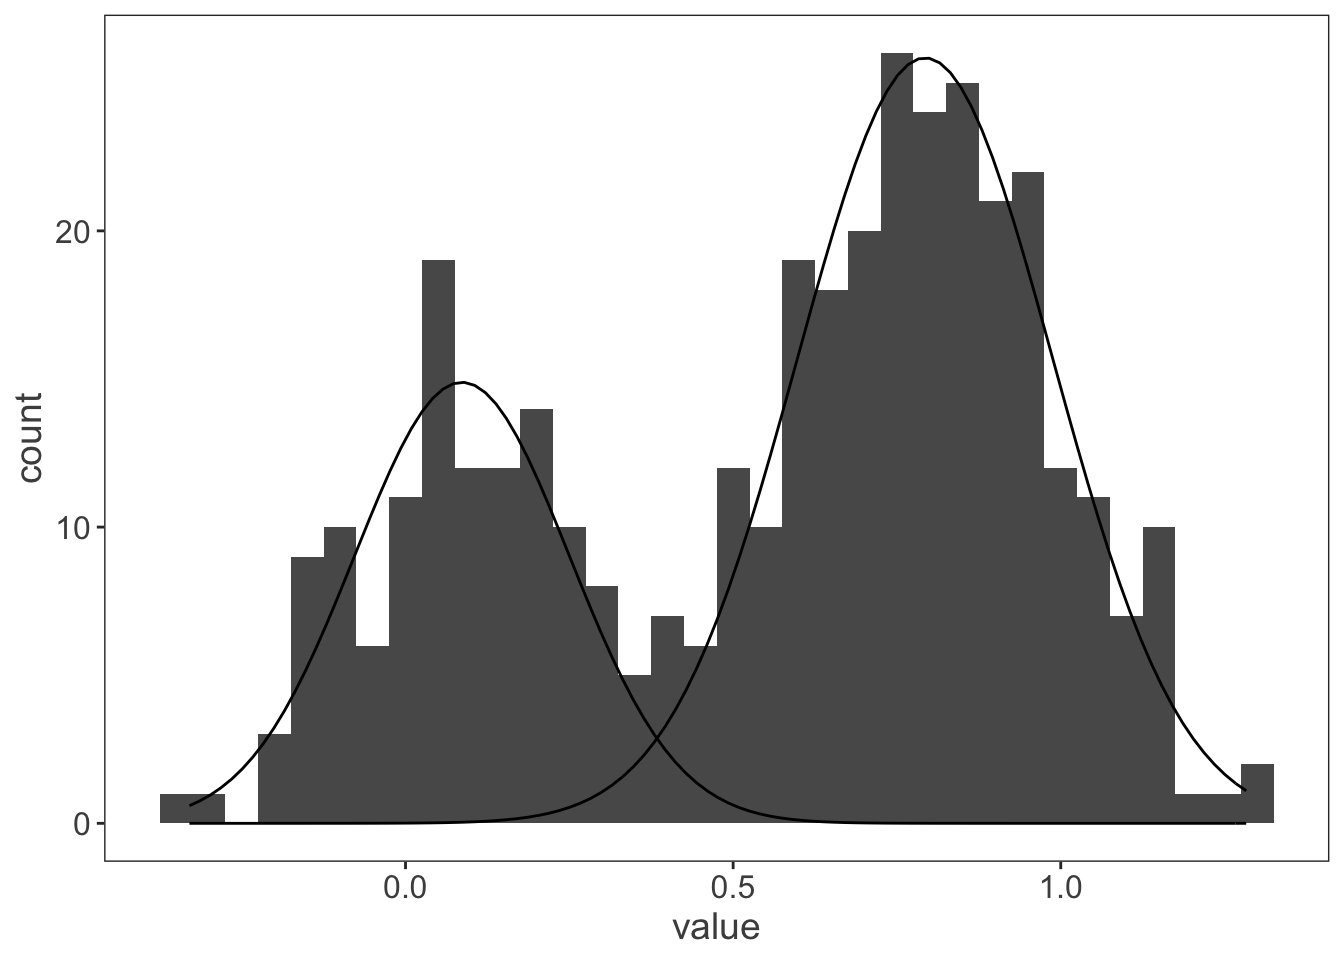
In the previous post I plotted multiple fit gaussians onto a data set with ggplot2 - the final model is actually the sum of these fitted gaussians though, so how do I plot that? This is a more tricksy problem. I know I need to nest the mapply function inside another function, but my mind doesn’t immediately leap to the answer - I tried to come up with something quickly, but it inevitably failed.

Continue reading

This post deals with something niche but practical - getting ggplot2 to plot multiple fitted gaussians from a model with different amplitudes. Google failed to provide the answer I was looking for - if you can’t find it with Google, it must need a blog post. We have a couple of different projects running at the moment that need us to think about mixture models - these are common in single molecule biophysics work as you frequently end up with two or more populations of molecules stretched out along a continuous variable; could be velocity, step size or something else.

Continue reading

Moving the blog

I moved my blog! Not just in terms of where it’s hosted, but how the whole thing is built. Previously I’d been using ghost, which was fine up until the moment I wanted to publish more code/analysis. The process of copy-pasting code and exporting images was taking more time than writing the code itself. I’m now using the blogdown package which builds static websites within RStudio using Hugo and lets you publish the results.

Continue reading

I have a bit of a love hate relationship with kymographs. In the way that they compress data there’s no doubt that you loose information, but in the world of axonal transport and low signal:noise they have clear advantages in enabling quantification. I covered before a couple of strategies you can use to import image data into R. The next step in my workflow is usually to turn that image into a data table for further analysis.

Continue reading

Andreas Prokop raised the issue of kinesin nomenclature on twitter over the weekend “I am tired of having to look up lists!”. I couldn’t agree more, it’s insanely confusing - especially when you’re trying to synthesise literature across several model organisms (shout out to Ustilago maydis and Dictyostelium discoideum here). Why is it confusing? The standardised kinesin nomenclature was defined in 2004, where the superfamily was divided into sub families. They even defined how motors should be referred to in the text.

Continue reading

The science twitter community can be a hugely beneficial resource, it can also be overwhelming if your new to it. I asked the scientists of twitter what platform they were using to interact with twitter itself (‘for a thing’). This post is not the thing I was eluding too, but the poll threw up a few tips I thought it worth drawing attention too and I figured I’d chuck some of my own tips in while I was at it.

Continue reading

Importing images into R

In May my paper was finally released into the wild. Amongst other things it was the culmination of 4 years of me learning to use R for data analysis (and in my case data = images of cells). I’ve been meaning to blog some of this for a while, but I will try for my own sanity to keep everything in bite size chunks. Starting at the start: data import.

Continue reading

Author's picture

Ali Twelvetrees

Research scientist looking at kinesin, dynein and neurons; trying to figure out how stuff moves around inside neurons and how it goes wrong in neurodegeneration.

Vice Chancellor’s Fellow

Sheffield