Importing images into R
In May my paper was finally released into the wild. Amongst other things it was the culmination of 4 years of me learning to use R for data analysis (and in my case data = images of cells). I’ve been meaning to blog some of this for a while, but I will try for my own sanity to keep everything in bite size chunks. Starting at the start: data import.
tiff : Read and write TIFF images
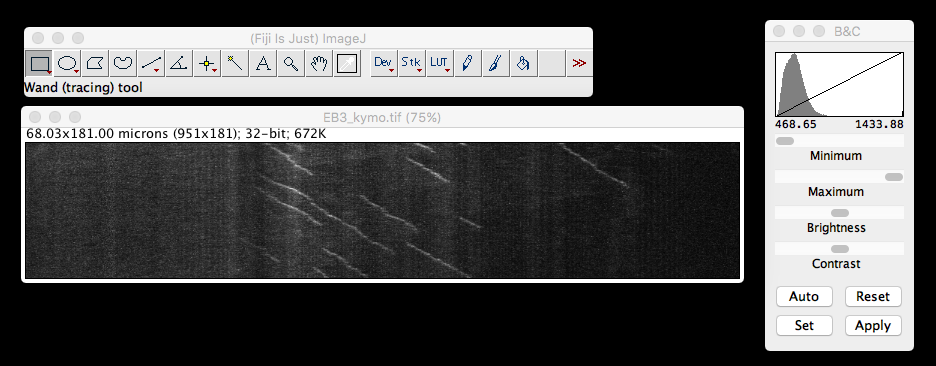
Up until this point I’ve only had need to ’port single plane .tif images of kymographs (of which, more later) generated in FIJI into R.
For this purpose, the ‘tiff’ package on
CRAN is more than
adequate: it has two very straight forward functions, readTIFF and
writeTIFF. It can handle 8-bit, 16-bit integer and 32-bit float samples (great
because my kymograph workflow culminates in a 32-bit float). Reading in a single
plane image creates a matrix. Reading in multiple channels creates an array.
The ‘tiff’ package can handle up to 4 channels (no z and t), so it is limited for
scientific image purposes, but small and simple has it’s advatages too.
library(tiff)
kymo <- readTIFF("MAX_Reslice_of_low_pass_axon_16bit.tif")

dim(kymo) #dimensions of the matrix, original image was 951 x 181 pixels
## [1] 181 950min(kymo) #minimum value of the matrix, B&C ImageJ viewer said 468.65## [1] 0max(kymo) #maximum value of the matrix, B&C ImageJ viewer said 1433.88## [1] 1kymo[1:5, 1:6] #display the first five rows and the first six columns of data## [,1] [,2] [,3] [,4] [,5] [,6]
## [1,] 0.2281071 0.1949645 0.1776913 0.1648585 0.1603571 0.1607843
## [2,] 0.1527733 0.1647364 0.1945373 0.1920958 0.2046693 0.2461891
## [3,] 0.2525826 0.2375677 0.2014038 0.1574426 0.1527733 0.1884642
## [4,] 0.1949340 0.1897612 0.1783322 0.2124056 0.1819638 0.1805905
## [5,] 0.2153201 0.2297551 0.2054322 0.1726101 0.1298543 0.1367361image(kymo) #quick auto display of the image data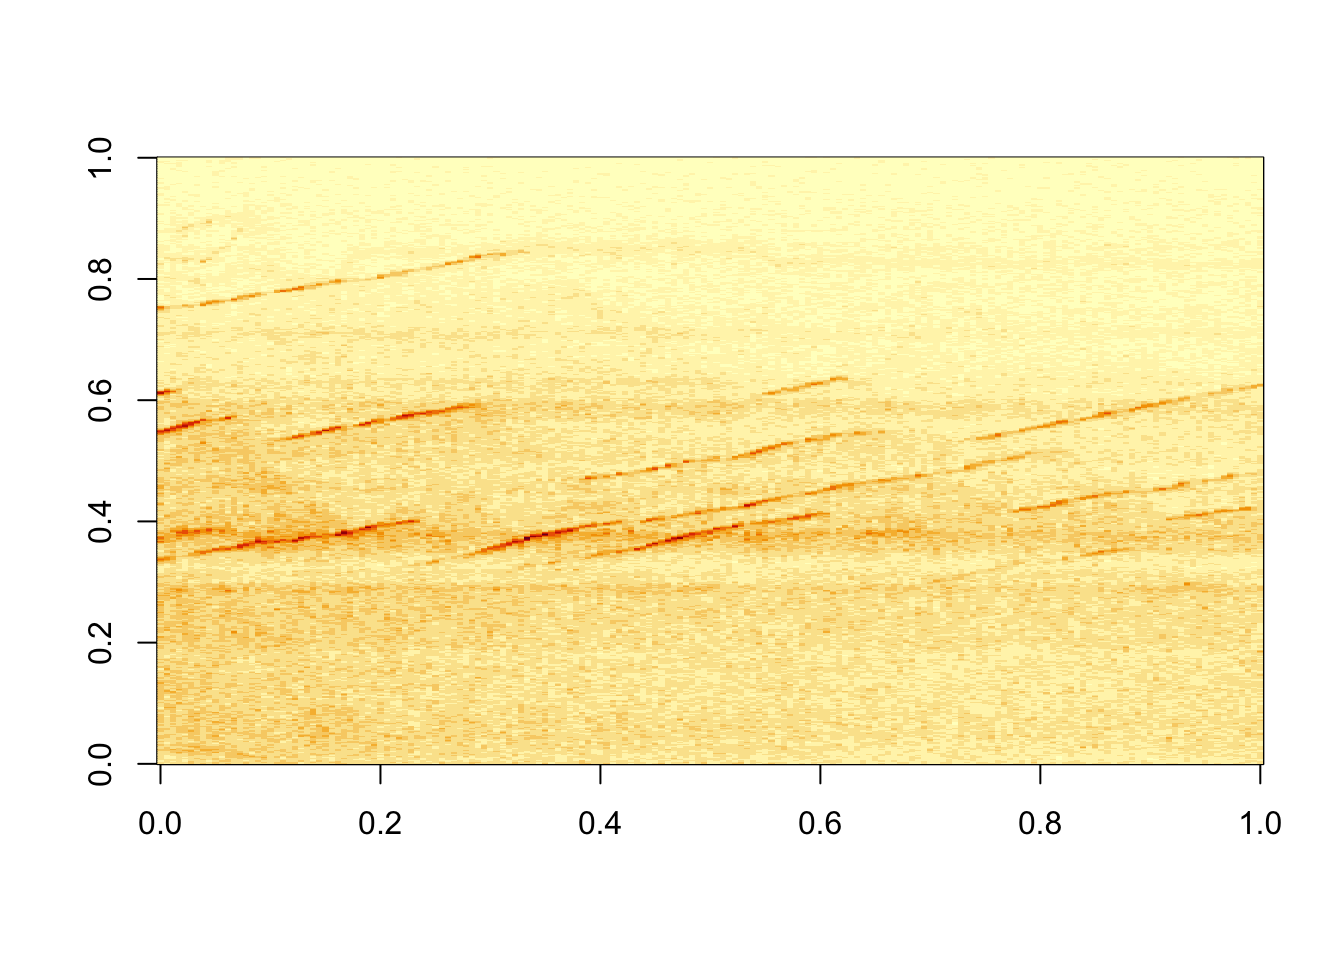
So that was easy! The power of R is now at your disposal. As a side note, the .tif file on my hard drive was 692kb, whilst the matrix is 1.3 Mb. There are also the equivalent packages for ‘jpeg’ and ‘png’ image formats.
EBImage : Image processing and analysis toolbox for R
‘EBImage’ is
a package avaiable on bioconductor. Essentially
it wraps up the ‘tiff’, ‘jpeg’ and ‘png’ packages and extends them to provide
better functionality for more complex image processing and analysis tasks. There
is a really great (recent) vignette for
EBImage,
so I won’t repeat too much here. It creates it’s own class, Image, to store and
process images. One part of this is the same array you get with the ‘tiff’
package. The other part is a list of attributes describing your image, which are
much better at handling z and t stacks than the ‘tiff’ package. One thing I will
say is that the display options can’t handle 32bit images, however you’ll also
notice that it automatically corrects the display oddities that happen with just
the raw array. (You can install EBImage by installing bioconductor with source("http://bioconductor.org/biocLite.R") followed by installing EBImage with
biocLite("EBImage"))
library("EBImage")

kymo2 <- readImage("MAX_Reslice_of_low_pass_axon_16bit.tif")

kymo2
## Image
## colorMode : Grayscale
## storage.mode : double
## dim : 950 181
## frames.total : 1
## frames.render: 1
##
## imageData(object)[1:5,1:6]
## [,1] [,2] [,3] [,4] [,5] [,6]
## [1,] 0.2281071 0.1527733 0.2525826 0.1949340 0.2153201 0.3075303
## [2,] 0.1949645 0.1647364 0.2375677 0.1897612 0.2297551 0.2842451
## [3,] 0.1776913 0.1945373 0.2014038 0.1783322 0.2054322 0.2771954
## [4,] 0.1648585 0.1920958 0.1574426 0.2124056 0.1726101 0.2917525
## [5,] 0.1603571 0.2046693 0.1527733 0.1819638 0.1298543 0.2816510display(kymo2, method = "raster") # setting method = "raster" previews images inside Rstudio, rather than in the interactive browser viewer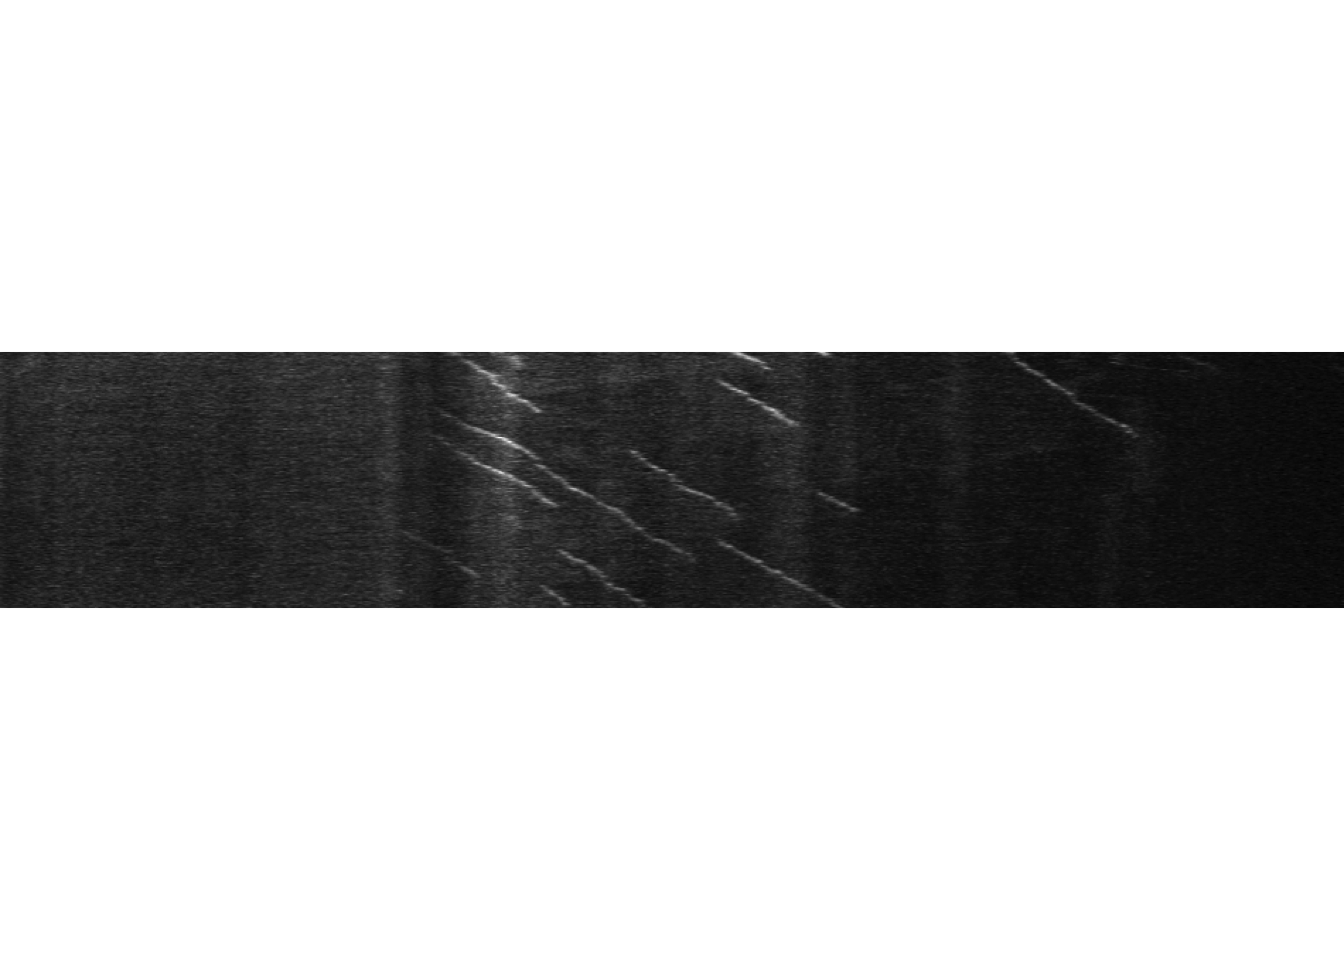
Other good stuff
RBioFormats
So as I was browsing the new EBImage vignette the other day (prompted by Steve Royal’s tweet, I love sci-twitter), I discovered something that pretty much made my day. There is an R interface to the Bio-Formats library on Github. I had no idea such a thing existed! I am now hankering after the day I can use this in a project. No more batch import/export in ImageJ!
imager : Image Processing Library Based on ‘CImg’
Before I go, to be completist, I also wanted to point to the ‘imager’ package. This is authered by Simon Barthelmé, a CNRS researcher at Gipsa-lab, Grenoble. There’s a version on CRAN, a develpoment version on GitHub, and quite a few useful vignettes available. Worth a look.

