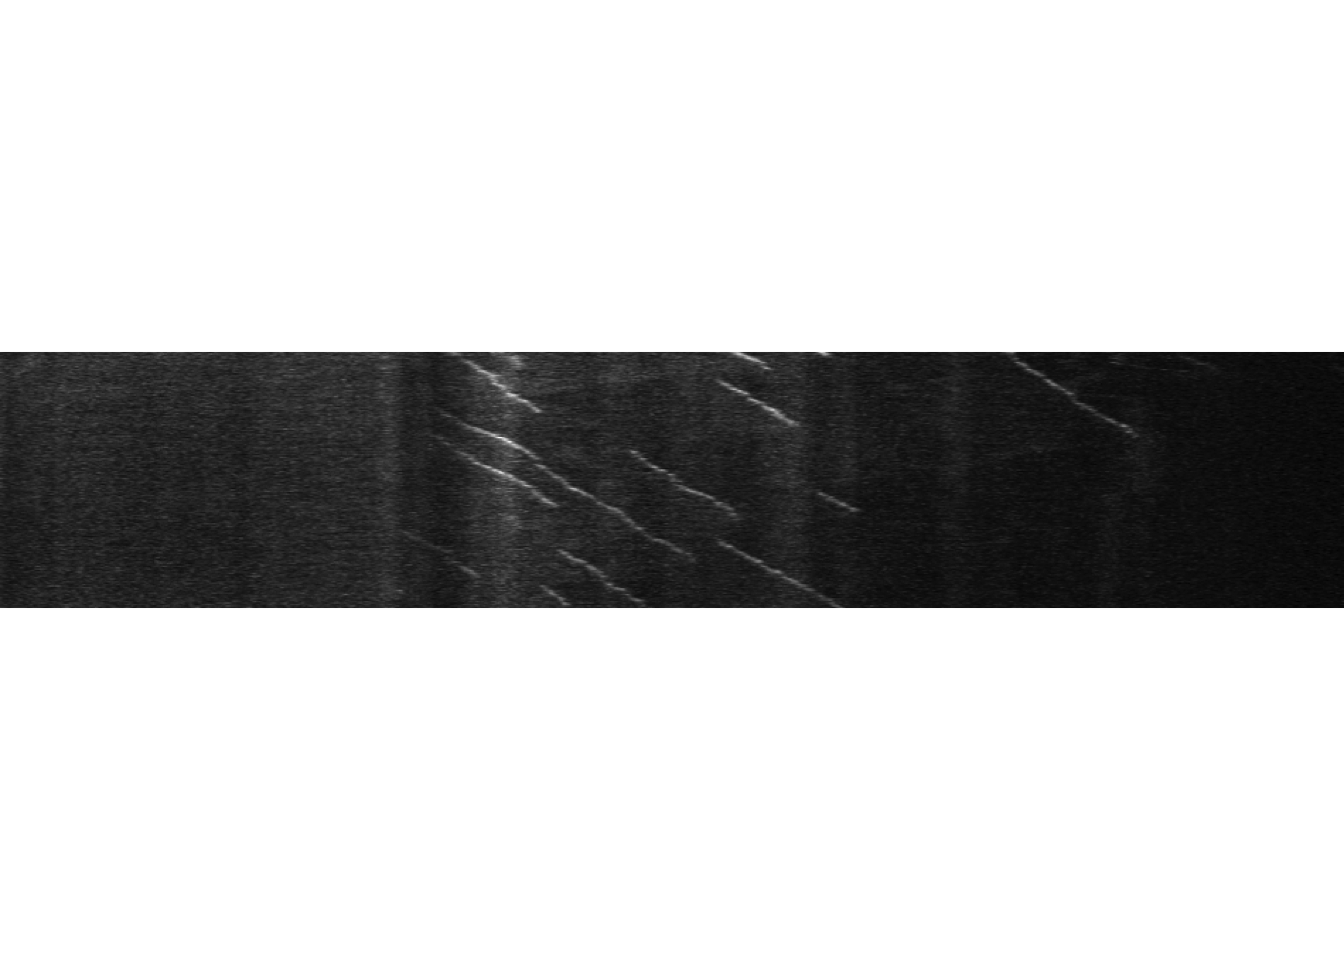
I have a bit of a love hate relationship with kymographs. In the way that they compress data there’s no doubt that you loose information, but in the world of axonal transport and low signal:noise they have clear advantages in enabling quantification.
I covered before a couple of strategies you can use to import image data into R. The next step in my workflow is usually to turn that image into a data table for further analysis.


